Redis Stack use cases
Explore examples of applied modern data models and processing engines in specific industries and applications
Querying, indexing, and search
Application search and external secondary index
RediSearch supports application search whether the source of record is another database or Redis itself. You can use RediSearch as an external secondary index (for example, for indexing numeric or full-text data) and as a full-text search engine.
Secondary index for Redis data
You can represent your data model using Redis hashes and RedisJSON documents. You can then declare secondary indexes to support various queries on your data set. RediSearch 2.0 updates indexes automatically whenever a hash/JSON document (that matches the indexes) is updated.
Geo-distributed search
In geo-distributed search, hashes/JSON documents are handled in the usual Active-Active manner. The index follows whatever is written in the documents in the database. Create an index on each database. Then, add synonyms (if used) to each database.
Unified search
You can use RediSearch to search across several source systems, like file servers, content management systems (CMS), or customer relationship management (CRM) systems. Process source data in batches (for example, using ETL tools) or as live streams (for example, using Kafka or Redis streams).
Analytics
Data often originates from several source systems. RediSearch can provide a materialized view of dimensions and facts. You can slice-and-dice data based on dimensions, group by dimension, and apply aggregations to facts.
Facets are multiple explicit dimensions implemented as tags in RediSearch. You can slice-and-dice data based on facets, achievable via RediSearch aggregations (COUNT, TOLIST, FIRST_VALUE, RANDOM_SAMPLE).
Ephemeral search (retail)
When the user logs on to the site, the purchase-search history is populated into a RediSearch index from another datastore. This requires lightweight index creation, index expiry, and quick document indexing.
The application/service creates a temporary and user-specific full-text index in RediSearch when a user logs in. The application/service has direct access to the user-specific index and the primary datastore. When the user logs out of the service, the index is explicitly removed. Otherwise, the index expires after a while (for example, after the user's session expires).
Using RediSearch for this type of application provides these benefits:
- Search index is only populated when needed.
- Only a small portion (for example, 2%) of users are actually active.
- Users are only active for a comparatively short period of time.
- Small number of documents indexed and so very cost effective in comparison to a persistent search index.
Real-time inventory (retail)
In real-time inventory retail, the key question is product availability: "What is available where?" The challenges with such projects are performance and accuracy. RediSearch allows for real-time searching and aggregations over millions of store/SKU combinations.
You can establish real-time event capture from legacy inventory system to RediSearch and then have several inventory services query RediSearch. Then, you can use combined queries, for example, item counts, price ranges, categories, and locations. Take advantage of geo-distributed search (Active-Active) for your remote store locations.
Using RediSearch for this type of application provides these benefits:
- Low-latency queries for downstream consumers like marketing, stores/e-commerce, and fulfillment
- Immediate and higher consistency between stores and datacenters
- Improved customer experience
- Real-time/more sensible pricing decisions
- Less shopping cart abandonment
- Less remediation (refund, cancellation)
Real-time conversation analysis (telecom)
Collect, access, store, and utilize communication data in real time. Capture network traffic and store it in a full-text index for the purposes of getting insights into the data.
Gather data using connection information gathering (source IPs, DNS) and conversation data gathering (Wireshark/TShark live capture). Then filter, transform, and store the conversation data in RediSearch to perform search queries and create custom dashboards for your analyses.
Using RediSearch for this type of application provides these benefits:
- Insights into performance issues, security threats, and network faults
- Improved service uptime and security
Research portal (academia)
Research portals let users search for articles, research, specs, past solutions, and data to answer specific questions and take advantage of existing knowledge and history.
To build such a system, you can use RediSearch indexes supporting tag queries, numeric range queries, geo-location queries, and full-text search (FTS).
Using RediSearch for this type of application provides these benefits:
- Create relevant, personalized search experiences all while enforcing internal and regulatory data governance policies
- Increased productivity, security, and compliance
Learn more
Querying, indexing, and search
JSON
You can of course use Redis native data structures to store JSON objects, and that's a common practice. For example, you can serialize JSON and save it in a Redis String.
However, RedisJSON provides several benefits over this approach.
Access and retrieval of subvalues
With RedisJSON, you can get nested values without having to transmit the entire object over the network. Being able to access sub-objects can lead to greater efficiencies when you're storing large JSON objects in Redis.
Atomic partial updates
RedisJSON allows you to atomically run operations like incrementing a value, adding, or removing elements from an array, append strings, and so on. To do the same with a serialized object, you have to retrieve and then reserialize the entire object, which can be expensive and also lack atomicity.
Indexing and querying
When you store JSON objects as Redis strings, there's no good way to query those objects. On the other hand, storing these objects as JSON using RedisJSON lets you index and query them. This is provided by RediSearch.
Learn more
Graph data
Resource management (identity and access management)
Identity and access management (IAM) is about ensuring the right entities have access to the right resources at the right times and for the right reasons.
There are two main components of IAM: authentication and authorization. Authentication is the process of confirming that users are who they say they are. authorization, on the other hand, is the process of deciding if a user has permissions to access a specific resource.
Graph databases are a great fit for handling the authorization part of IAM.
Traditionally, IAM has been modeled hierarchically. An admin/owner in an organization that is able to access every resource. That admin owns different departments of the organization, the departments are split into different teams, and every team has its employees, where an employee can only be a part of one team. With this kind of hierarchical view, you can't' model an employee who has functions on different teams, or even different departments, which is not unusual in a modern enterprise, and even less in the startup domain.
Consider a scenario where one department is allowed access to a group of documents, but one employee, in particular, has been assigned to work with a different team and needs to have access to a specific document belonging to that team. Or you have an external partner to whom you need to give temporary access. Or maybe you just don't want to allow a single admin access to everything in the company.
Today, companies employ a more distributed and decentralized management system, where one employee can serve multiple functions, can change roles often, and the boundaries between teams are often blurred in an IAM context. Traditional IAM has a very static view of the world, working with the typical add, move, and leave operations, where the entities are owned by the enterprise, but those do not reflect the modern organization anymore.
Another problem with the traditional model is auditing. Access is typically granted either by group or individual, but once it is granted it is very difficult to audit and questions like, "Why does this group or user have all this access? Should they have it?" are difficult to answer. The way some companies deal with this problem usually is by large-scale revoking of access and then granting it back to people individually.
Running complex queries on this kind of a model can take minutes, and often even hours, so it's very common for big organizations to run nightly batches and cache the results that are going to be queried the next day. But with this kind of a setup, you are querying stale data for a long time. What if an employee quits in the morning? They can access data for another day until the system realizes they're no longer part of the organization. And vice versa, when an employee joins a company on Monday morning, they will have to wait until the next day to be able to access the system.
When modeling the entities in an organization and their relationships with a graph, you end up with a very intuitive data model that closely reflects the domain. Because graphs are schemaless and relationships are first-class citizens, you can connect any two entities, without the need to completely refactor the model, while at the same time giving as much context as needed to the relationship. Traversals on this dataset can be multidimensional and can query data across different hierarchies (asset hierarchy, organizational, hierarchy, partner hierarchy). With a native graph database, you can get real-time responses to these queries, so you always have the latest insight into who is allowed to access which resource and why.
The above scenario could be modeled very simply with the following graph.
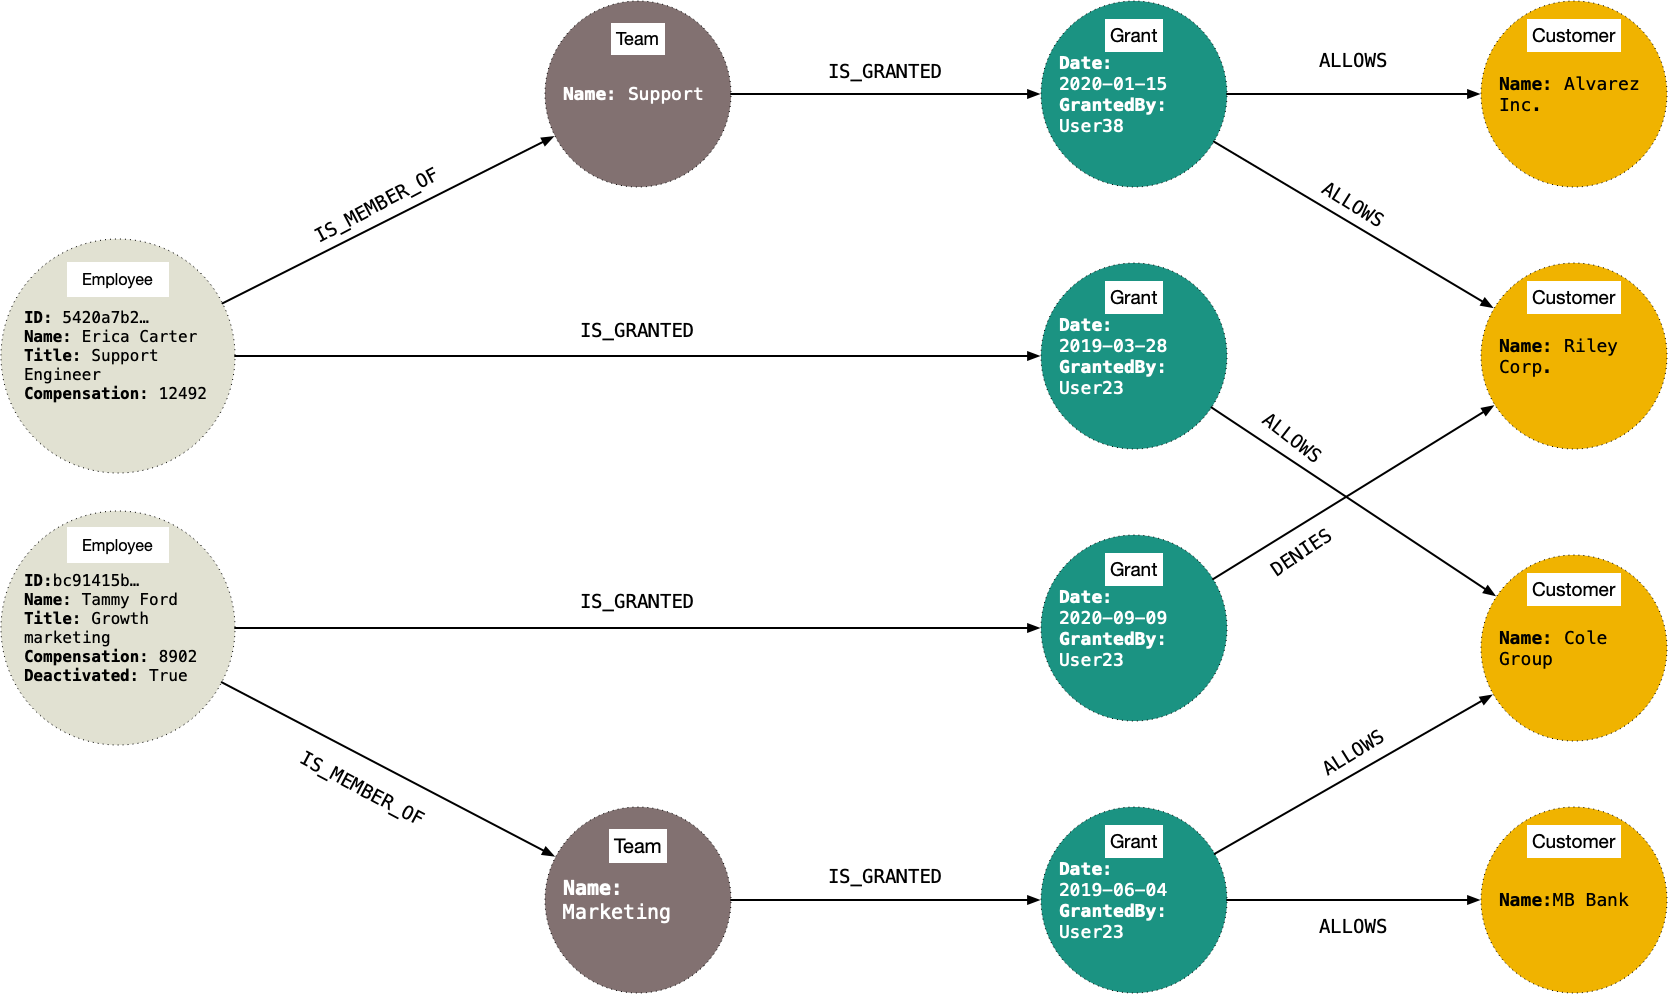
This kind of model allows you to run all kinds of queries, like:
- Who has access to a specific resource?
- Who grants access to this resource?
- When did employee A get access to resource B?
- Who granted employee A access to resource B?
- What are all the entities (internal employees, external collaborators, 3rd party service accounts) that have access to a specific resource?
- Which employees have been denied access to a specif resource, who denied it and when?
Resource management (supply chain)
When you model a supply chain with a graph, you can get interesting insights out of your data, helping you make important business and logistic decisions. For example, a graph database can help you recalculate an alternative route from factory A to consumer B during issues by answering these questions:
- Where did this food contamination start and where it could have spread?
- What is going to be the downstream consequence of this manufacturer reporting that they couldn't obtain enough copper? Which parts are they not going to be able to produce, and how will that influence our distribution network and retailers?
- What is the spread of my product (in which countries/cities is it used)?
- In which factories/storages has this product been before arriving in a specific shop?
- What is the fastest way to move from factory A to consumer B?
- What is the most cost-effective way to move from factory A to consumer B?
Recommendation engine (social networks)
A graph database can help you highlight for user A a post that many of their friends have commented on and recommend videos with a global score of above 4 by answering these questions:
- Who are the friends of my friend?
- Who are the friends of my friend A, who are also friends with person B?
Recommendation engine (retail)
A graph database can help recommend to user A products that their friends have bought, and that currently have a margin higher than X percent and large stock in a storage close to them by answering these questions:
- What are other products in a similar price range and with a similar textile as what this user usually buys?
- What are some products that other users have bought together with the product this user just added to their cart?
- In which store in my city can I locate this item?
Geo navigation (commerce and travel)
- List all coffee shops in an area of 2 km, with an average rating higher than 3.5.
- List all parks around me that my friends have been to.
Operations management (networks and IT)
- Which parts of the network does this customer rely on?
- Which customers/applications will be affected if this network element fails?
- Is there redundancy in the network for this customer?
Fraud detection
-
Fraud in health care: Are there any doctors/clinics that are prescribing an unusually high number of a certain drug?
-
Fraud in telecom: Does this call/SMS follow a regular calling pattern? It is a new account that just dialed an unusually high number of people, with a short average call-time and was rejected many times, so the receiver of the call should be warned by a real-time notification.
-
Fraud in finance: Is this transaction between sender A and recipient B valid? Has the card used by the sender been reported as stolen? Has the device that the recipient is using ever been connected to a fraudulent account?
Learn more
Time series data
Monitoring (data center)
Modern data centers have a lot of moving pieces, such as infrastructure (servers and networks) and software systems (applications and services) that need to be monitored around the clock.
RedisTimeSeries allows you to plan for new resources upfront, optimize the utilization of existing resources, reconstruct the circumstances that led to outages, and identify application performance issues by analyzing and reporting on the following metrics:
- Maximum CPU utilization per server
- Maximum network latency between two services
- Average IO bandwidth utilization of a storage system
- 99th percentile of the response time of a specific application outages
Weather analysis (environment)
RedisTimeSeries can be used to track environmental measurements such as the number of daily sunshine hours and hourly rainfall depth, over a period of many years. Seasonally, you can measure average rainfall depth, average daily temperature, and the maximum number of sunny hours per day, for example. Watch the increase of the maximum daily temperature over the years. Predict the expected temperature and rainfall depth in a specific location for a particular week of the year.
Multiple time series can be collected, each for a different location. By utilizing secondary indexes, measurements can be aggregated over given geographical regions (e.g., minimal and maximal daily temperature in Europe) or over locations with specific attributes (e.g., average rainfall depth in mountainous regions).
Example metrics include:
- Rain (cm)
- Temperature (C)
- Sunny periods (h)
Analysis of the atmosphere (environment)
The atmospheric concentration of CO2 is more important than ever before. Use TimeSeries to track average, maximum and minimum CO2 level per season and average yearly CO2 over the last decades. Example metrics include:
- Concentration of CO2 (ppm)
- Location
Flight data recording (sensor data and IoT)
Planes have a multitude of sensors. This sensor data is stored in a black box and also shared with external systems. TimeSeries can help you reconstruct the sequence of events over time, optimize operations and maintenance intervals, improve safety, and provide feedback to the equipment manufacturers about the part quality. Example metrics include:
- Altitude
- Flight path
- Engine temperature
- Level of vibrations
- Pressure
Ship logbooks (sensor data and IoT)
It's very common to keep track of ship voyages via (digital) logbooks. Use TimeSeries to calculate optimal routes using these metrics:
- Wind (km/h)
- Ocean conditions (classes)
- Speed (knots)
- Location (long, lat)
Connected car (sensor data and IoT)
Modern cars are exposing several metrics via a standard interface. Use TimeSeries to correlate average fuel consumption with the tire pressure, figure out how long to keep a car in the fleet, determine optimal maintenance intervals, and calculate tax savings by type of the road (taxable vs. nontaxable roads). Example metrics include:
- Acceleration
- Location (long, lat)
- Fuel level (liter)
- Distances (km)
- Speed (km/h)
- Tire pressure
- Distance until next maintenance check
Smart metering (sensor data and IoT)
Modern houses and facilities gather details about energy consumption/production. Use RedisTimeSeries to aggregate billing based on monthly consumption. Optimize the network by redirecting the energy delivery relative to the fluctuations in need. Provide recommendations on how to improve the energy consumption behavior. Example metrics include:
- Consumption per location
- Produced amount of electrical energy per location
Quality of service (telecom)
Mobile phone usage is increasing, producing a natural growth that just correlates to the increasing number of cellphones. However, there might also be spikes that correlate with specific events (for example, more messages around world championships).
Telecom providers need to ensure that they are providing the necessary infrastructure to deliver the right quality of service. This includes using mini towers for short-term peaks. Use TimeSeries to correlate traffic peaks to specific events, load balance traffic over several towers or mini towers, and predictively plan the infrastructure. Metrics include the amount of traffic per tower.
Stock trading (finance)
Stock trading is highly automated today. Algorithms, and not just human beings, are trading, from the amount of bids and asks for the trading of a stock to the extreme volumes of trades per second (millions of ops per second). Computer-driven trading requires millisecond response times. It's necessary to keep a lot of data points within a very short period of time (for example, price fluctuations per second within a minute). In addition, the long-term history needs to be kept to make statements about trends or for regulatory purposes.
Use RedisTimeSeries to identify correlations between the trading behavior and other events (for example, social network posts). Discover a developing market. Detect anomalies to discover insider trades. Example metrics include:
- Exact time and order of a trade by itself
- Type of the event (trade/bid)
- The stock price
Learn more
Redis Stack time series support
Probabilistic data structures
Probabilistic data structures provide a variety of different properties that can have applications across many different industries.
Bloom and Cuckoo filters
Financial fraud detection (finance)
This application answers the question, "Has the user paid from this location before?", thus checking for suspicious activity in their users' shopping habits.
Use one Bloom filter per user, checked for every transaction. Provide an extremely fast response (local latency). Replicate in different regions in case the user moves. Prevent decreasing performance with scale.
Using RedisBloom for this type of application provides these benefits:
- Fast transaction completion
- Decreased possibility for transaction to brake in case of network partitions (connection needs to be kept open for a shorter time)
- Extra layer of security for both credit card owners and retailers
Other questions a Bloom filter can help answer in the finance industry are:
- Has the user ever made purchases in this category of products/services?
- Do I need to skip some security steps when the user is buying with a vetted online shop (big retailers like Amazon, Apple app store...)?
- Has this credit card been reported as lost/stolen? An additional benefit of using a bloom filter in the last case is that financial organizations can exchange their lists of stolen/blocked credit card numbers without revealing the numbers themselves.
Ad placement (retail, advertising)
This application answers these questions:
- Has the user already seen this ad?
- Has the user already bought this product?
Use a Bloom filter for every user, storing all bought products. The recommendation engine suggests a new product and checks if the product is in the user's Bloom filter.
- If no, the ad is shown to the user and is added to the Bloom filter.
- If yes, the process restarts and repeats until it finds a product that is not present in the filter.
Using RedisBloom for this type of application provides these benefits:
- Cost efficient way to a customized near real-time experience
- No need to invest in expensive infrastructure
Check if a username is taken (SaaS, content publishing platforms)
This application answers this question: Has this username/email/domain name/slug already been used?
Use a Bloom filter for every username that has signed up. A new user types in the desired username. The app checks if the username exists in the Bloom filter.
- If no, the user is created and the username is added to the Bloom filter.
- If yes, the app can decide to either check the main database or reject the username.
The query time stays the same at scale.
Using RedisBloom for this type of application provides these benefits:
- Very fast and efficient way to do a common operation
- No need to invest in expensive infrastructure
Targeted ad campaigns (advertising, retail)
This application answers this question: Has the user signed up for this campaign yet?
Use a Cuckoo filter for every campaign, populated with targeted users' ids. On every visit, the user id is checked against one of the Cuckoo filters.
- If yes, the user has not signed up for campaign. Show the ad.
- If the user clicks ad and signs up, remove the user id from that Cuckoo filter.
- If no, the user has signed up for that campaign. Try the next ad/Cuckoo filter.
Discount code/coupon validation (retail, online shops)
This application answers this question: Has this discount code/coupon been used yet?
Use a Cuckoo filter populated with all discount codes/coupons. On every try, the entered code is checked against the filter.
- If no, the coupon is not valid.
- If yes, the coupon can be valid. Check the main database. If valid, remove from Cuckoo filter as
used.
Count-Min sketch
Products (retail, online shops)
This application answers this question: What was the sales volume (on a certain day) for a product?
Use one Count-Min sketch created per day (period). Every product sale goes into the CMS. The CMS give reasonably accurate results for the products that contribute the most toward the sales. Products with low percentage of the total sales are ignored.
Top K
Leader boards (gaming)
This application answers this question: Who are the K players with the highest score?
Data flow is the incoming game scores. Flow id is the user id, and the value is the score. A separate sorted set is kept, storing the top K users' ids and their scores. Every time a user scores points, they're added to the Top K list.
- If the result is
nil, the user is already in the Top K. Update the sorted set with the user's new score. - if the result is an id of another player, the player you just added (
id1) took over the player who got returned (id2). Remove playerid2from the sorted set and add playerid1.
Trending hashtags (social media platforms, news distribution networks)
This application answers these questions:
- What are the K hashtags people have mentioned the most in the last X hours?
- What are the K news with highest read/view count today?
Data flow is the incoming social media posts from which you parse out the different hashtags.
The TOPK.LIST command has a time complexity of O(K) so if K is small, there is no need to keep a separate set or sorted set of all the hashtags. You can query directly from the Top K itself.
HyperLogLogs
Anonymous unique visits of a web page (SaaS, analytics tools)
This application answers these questions:
- How many unique visits has this page had on this day?
- How many unique users have played this song?
- How many unique users have viewed this video?
Storing the IP address or any other kind of personal identifier is against the law in some countries, which makes it impossible to get unique visitor statistics on your website.
One HyperLogLog is created per page (video/song) per period, and every IP/identifier is added to it on every visit.
T-Digest
Hardware/software monitoring
You measure your online server response latency, and you like to query:
-
What are the 50th, 90th, and 99th percentiles of the measured latencies?
-
Which fraction of the measured latencies are less than 25 milliseconds?
-
What is the mean latency, ignoring outliers? or What is the mean latency between the 10th and the 90th percentile?
Online gaming
Millions of people are playing a game on your online gaming platform, and you want to give the following information to each player?
-
Your score is better than x percent of the game sessions played.
-
There were about y game sessions where people scored larger than you.
-
To have a better score than 90% of the games played, your score should be z.
Network traffic monitoring
You measure the IP packets transferred over your network each second and try to detect denial-of-service attacks by asking:
-
Does the number of packets in the last second exceed 99% of previously observed values?
-
How many packets do I expect to see under normal network conditions? (Answer: between x and y, where x represents the 1st percentile and y represents the 99th percentile).
Predictive maintenance
-
Was the measured parameter (noise level, current consumption, etc.) irregular? (not within the [1st percentile...99th percentile] range)?
-
To which values should I set my alerts?